
What Awaits Us in 10 Years?
If you have one horse, then you have one horse, which, it is true, grows old with time and becomes unusable for work. A completely different story is with money. If you have one hundred lats, then with those one hundred lats you can purchase a certain number of goods or services. A year from now you will also have one hundred lats, but the number of goods you can purchase with them will have changed.
If you have one horse, then you have one horse, which, it is true, grows old with time and becomes unusable for work. As a result, it is turned into sausage. During its lifetime it manages to "produce" many foals and through its work creates value for its owner, which if desired can be exchanged for other things needed at a particular moment. A completely different story is with money. If you have one hundred lats, then with those one hundred lats you can purchase a certain number of goods or services. A year from now you will also have one hundred lats, but the number of goods you can purchase with them will have changed. Most likely it will have decreased.
Thesis: by saving money for a rainy day, its value - as time passes - decreases.
Since money is no longer tied to anything real (gold), and the state can print it as needed, it can still be expressed in labour / goods / service equivalents. Unfortunately, the value of money is determined by the market, and however odd this may sound, money too can become now more expensive, now cheaper, and in conditions of the global economy, a certain amount of money can purchase a variable number of goods.
Thesis: prices of goods and services grow faster than wages.
It is a well-known fact that everything becomes more expensive. Wages also grow. Logically one might think that everything is in balance and such growth is proportional. But it is not. And as can be seen in the study set out below, certain categories of goods/services grow faster, and the growth of wages in various professions changes similarly. As a result, the intention to save for old age, as banks encourage one to do, can lead to a quite unexpected outcome - namely that with savings built up over a lifetime, upon reaching a certain age one will be able to purchase only a negligible quantity of goods and services. In other words - the savings will become worthless.
Thesis: it is not possible to protect the value of money by saving it passively (including in pension funds).
It should be noted here that savings dynamics are greatly influenced by how much money is deposited. In countries where this pension fund saving works, nearly half of the salary is invested - which is several hundred or even thousands, not just a few dozen lats that the average Latvian resident can set aside.
Changes in Consumer Good Prices.
| 95 | 96 | 97 | 98 | 99 | 00 | 01 | 02 | 03 | 04 | 05 | 06 | 07 | 08 | 09 | 10 | 11 | 12 | |
| Milk, per 1 litre | 0.23 | 0.26 | 0.26 | 0.25 | 0.23 | 0.22 | 0.23 | 0.24 | 0.24 | 0.3 | 0.35 | 0.39 | 0.46 | 0.59 | 0.48 | 0.51 | 0.6 | 0.59 |
| Potatoes | 0.23 | 0.18 | 0.13 | 0.18 | 0.16 | 0.13 | 0.14 | 0.23 | 0.17 | 0.17 | 0.2 | 0.3 | 0.36 | 0.32 | 0.29 | 0.24 | 0.33 | 0.23 |
| Rye-wheat bread | 0.26 | 0.31 | 0.33 | 0.33 | 0.33 | 0.32 | 0.3 | 0.31 | 0.3 | 0.31 | 0.34 | 0.39 | 0.49 | 0.67 | 0.7 | 0.66 | 0.67 | 0.69 |
| Petrol A-95 ** | 0.25 | 0.25 | 0.3 | 0.312 | 0.314 | 0.389 | 0.383 | 0.378 | 0.4 | 0.45 | 0.56 | 0.6 | 0.63 | 0.71 | 0.67 | 0.77 | 0.9 | 0.98 |
| Electricity, per 100 kWh | 1.79 | 3.1 | 3.59 | 3.9 | 3.9 | 3.9 | 3.9 | 3.9 | 3.9 | 4.5 | 4.5 | 4.75 | 5.1 | 6.6 | 7.43 | 7.43 | 9.12 | 9.37 |
* Data obtained from the Central Statistical Bureau of Latvia.
** Petrol A-95. Values converted from 10L to 1L
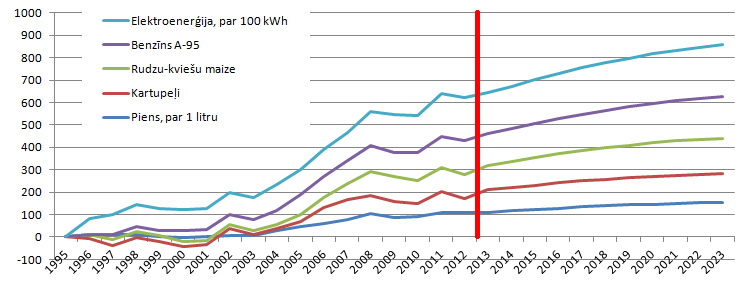
Figure 1. Consumer prices. Values in percent.
As can be seen, since 1995 electricity and petrol have grown the fastest. Over 18 years growing by as much as 200%, or 11%/year. Food prices have grown the least, although the average increase is around 100%, or approximately 50% over 10 years, or 5% per year.
Housing Costs
The second, no less important expenditure category is housing costs, consisting mostly of heat and water consumption. As can be seen in the diagram (see below), since 2006 the total housing bill has grown from 35 Ls to 126 Ls, or in percentage terms by 150%, or ~20%/year.
Data obtained from I. Brante's observations.
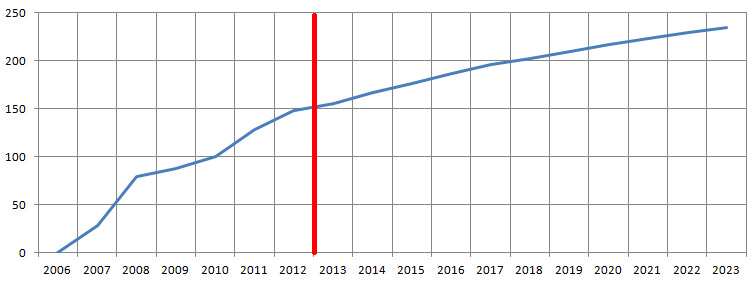
Figure 2. Housing costs (February). Values in percent.
Bank Deposit Interest Rates
Looking at bank deposit interest rates by year (guaranteed interest rate), we can see that deposit interest was historically higher either at times of high inflation (because after period x the bank would have to return less valuable money) or during rapid economic growth - which this time turned out to be the real estate boom. Calculating future deposit values based on historical dynamics, there is a degree of hope that the guaranteed interest rate might increase slightly (reaching the 5% mark), although it should be noted that these are technical calculations and are not based on any economic data.
Deposit interest rates for bank deposits in 2012 are only 2.4%/year.
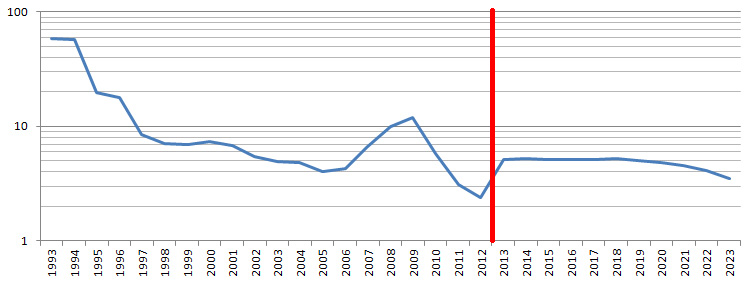
Figure 3. Bank deposit interest rates.
Wage Growth
| 2005 | 2006 | 2007 | 2008 | 2009 | 2010 | 2011 | 2012 | |
| (A) Agriculture, forestry and fishing | 155 | 183 | 256 | 305 | 298 | 299 | 323 | 327 |
| (B) Mining and quarrying | 184 | 237 | 313 | 377 | 372 | 361 | 364 | 366 |
| (C) Manufacturing | 154 | 191 | 252 | 307 | 304 | 290 | 304 | 317 |
| (D) Electricity, gas supply, heat supply and air conditioning | 282 | 333 | 437 | 468 | 448 | 455 | 471 | 492 |
| (E) Water supply; sewerage, waste management and remediation | 162 | 199 | 277 | 342 | 336 | 320 | 339 | 352 |
| (F) Construction | 153 | 200 | 269 | 325 | 327 | 296 | 311 | 320 |
| (G) Wholesale and retail trade; repair of motor vehicles and motorcycles | 141 | 177 | 237 | 293 | 288 | 265 | 281 | 294 |
| (H) Transportation and storage | 191 | 222 | 286 | 362 | 368 | 353 | 355 | 381 |
| (I) Accommodation and food service activities | 110 | 136 | 176 | 219 | 217 | 206 | 218 | 226 |
| (J) Information and communication services | 322 | 385 | 442 | 555 | 575 | 531 | 546 | 560 |
| (K) Financial and insurance activities | 419 | 513 | 621 | 737 | 701 | 641 | 668 | 692 |
| (L) Real estate activities | 141 | 183 | 233 | 279 | 276 | 261 | 285 | 297 |
| (M) Professional, scientific and technical activities | 212 | 266 | 340 | 408 | 418 | 409 | 433 | 455 |
| (N) Administrative and support service activities | 147 | 188 | 249 | 316 | 311 | 297 | 310 | 318 |
| (O) Public administration and defence; compulsory social insurance | 251 | 305 | 418 | 489 | 413 | 364 | 387 | 404 |
| (P) Education | 172 | 212 | 284 | 354 | 326 | 282 | 287 | 290 |
| (Q) Human health and social work activities | 166 | 213 | 292 | 356 | 328 | 299 | 311 | 319 |
| (R) Arts, entertainment and recreation | 136 | 182 | 261 | 317 | 287 | 263 | 276 | 284 |
| (S) Other service activities | 123 | 132 | 171 | 217 | 251 | 255 | 285 | 303 |
* Data obtained from the Central Statistical Bureau of Latvia.
Data are available only for the last 8 years, but indicate the growth dynamics. The lowest wage growth is observed in public administration. Following the 2009 turning point, the financial and insurance sector joined it. The greatest wage growth dynamics are observed for Group S professions according to the NACE professional classification, which includes: Activities of public, political and other organisations; Repair of computers, personal and household goods.
It should be noted that the growth dynamics are being analysed, not the level of how high or low wages were/are. Wage growth since 2005, that is over 8 years, amounts to from 56 to 100% (respectively 7 to 12%/year).
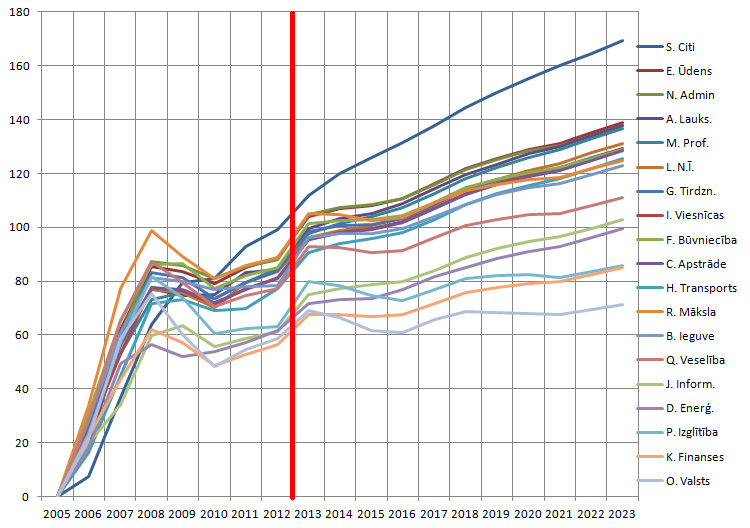
Figure 4. Wage (net) change dynamics. Values in percent.
In Conclusion
Unless you are a financial genius and cannot rely on the guaranteed return of financial instruments, unless you have inherited considerable wealth, or unless you are shrewd enough to earn a great deal while doing nothing - in order to keep up with the growth of goods and service prices you will simply have to work. Perhaps even retrain, mastering one of the predictably higher-earning professions. In any case, bank deposits do not look like they will be of much help in solving financial difficulties for some time yet. Moreover, unless you can set aside half of your salary for a future pension, you will have no choice but to rely on and hope in the state.
comments